Analytics Dashboards
Dashboards provide personalized views of corporate and external information. A
dashboards can display anything that you can access or open with your Web
browser, such as saved reports, alerts, images, graphs, tables, text, and links to Web
sites and documents.
note: Dashboard reports can take up to several minutes to display depending on
the amount data required to generate a particular report.
Screen

Home Page
Details
Dashboards consist of columns and sections that hold and display the content of a
dashboard. You can use multiple dashboards to organize your information. For example,
you might have one dashboard to store results that you refer to every day,
another that contains information related to your team, and so on.
Administrators can use the dashboard editor to add drag and drop content to one or
more dashboards, and to control the corresponding dashboard layouts. Administrators
can also adjust the look of a dashboard, such as background colors and the size
of text.
note: Dashboard creation is reserved for users with administrative responsibilities. Permission
to modify dashboards (personal and shared) is granted to a broader range of
users, as determined by an administrator.
Data Security
Dashboards and reports in Analytics restrict sales users to viewing data generated
between the effective position start and end dates.
For example, if Joe is the Western Area Director from July 15, 2013 to June 30, 2014, he
will be able to view data in Analytics from July 2013 to June 2014 for members of the
hierarchy that report to him. Joe will not, however, be able to view data for these subordinates
before or after this period.
Definitions
The following table provides definitions for common terms in dashboards:


Exploring the Default Dashboards
Analytics offers the following dashboards, by default, in the My Dashboards pane:

Information About the Data that Appears on Dashboards
Analytics displays the following information about the data that appears on each
dashboard:
• Data Last Updated—The date and time at which the Analytics data was last
updated with data from Incent.
• Data based on sales team as of—The hierarchy date (Incent organization hierarchy) used for filtering all reports for people in the hierarchy. The date automatically reflects the preferences selected in Incent (Last Closed Period, First Open Period, Period Prior To Current Date, and Current Date Period).
You can modify the format of the date along with the time zone by setting the corresponding
preferences in Incent. For more information, see “Change the Date Format
for the Organization” on page 23, “Change the Time Zone for the Organization” on
page 23, and “Change the Date Format and Time Zone for a User” on page 24.
Note that user-defined preferences override preferences set for your business.
note: Amounts on the predefined dashboards are rounded to the nearest integer.
Use the Default Dashboards
1. Click the Home tab.
![]()
The Business Dashboards page appears with your currently-accessible dashboards
displayed (as a list) in the My Dashboards pane.
2. Select the dashboard to display in the My Dashboards pane.
The following default dashboards are available:
• Revenue Analysis
• Team Performance
• Incentive Analysis
• Cost Analysis
note: The specific dashboards that appear depends on how your administrator
has configured Analytics in the Setup > Roles area of Incent.
The dashboard content appears.
3. Using the Enter the Year drop-down list, select the year for which you want to display
the information, and click the ![]() button.
button.
The corresponding information appears in the dashboard.
To reset the dashboard, click the ![]() button and choose from among the
button and choose from among the
following menu options:
• Reset to last applied values—Resets the Enter the Year field to the last value
that you applied.
• Reset to default values—Resets the Enter the Year field to the default value.
• Clear All—Clears the Enter the Year field.
4. Review the information displayed on the dashboard.
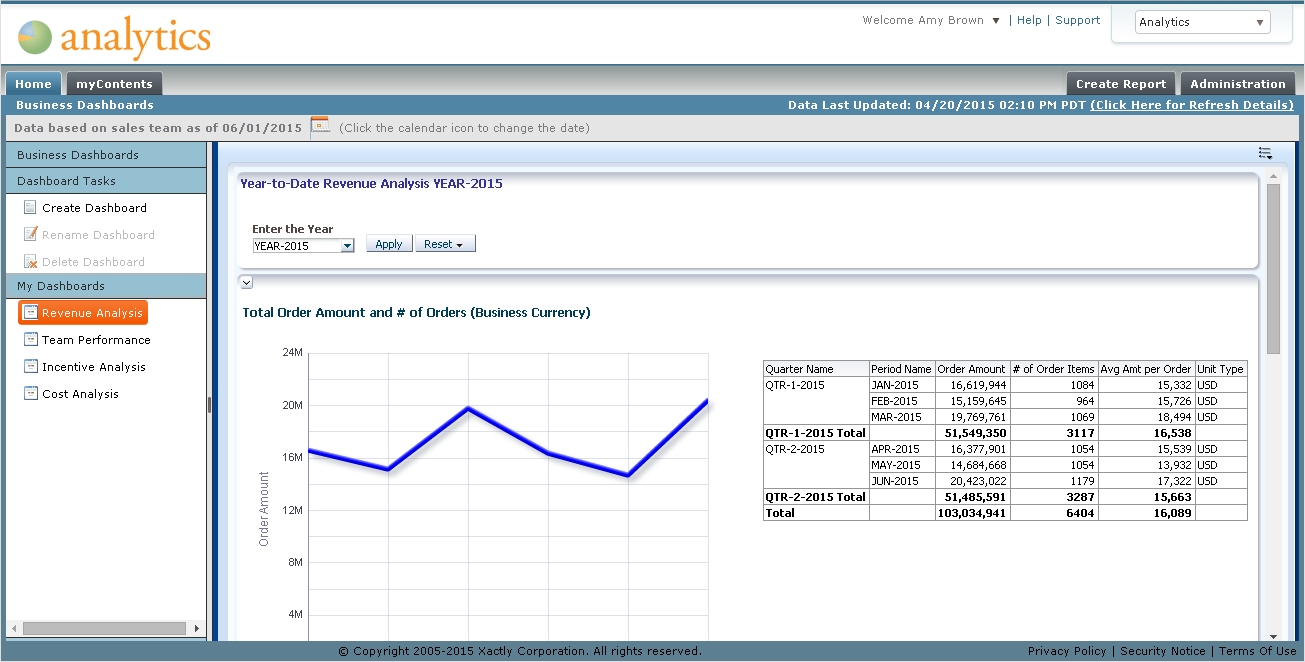
The Revenue Analysis dashboard displays the following information (in the business
currency):
• Total Order Amount and # of Orders
• Top 10 Customers by Order Amount
• Top 10 Products Sold by Order Amount
The Team Performance dashboard displays the following information (in the business
currency):
• Top 10 Performers by Total Order Amount
• Annual Incentive Target Attainment (by person)
• Quarterly Quota Attainment by Person QTD (by person)
• Annual Quota Attainment by Person YTD (by person)
The Incentive Analysis dashboard displays the following information (in the business
currency):
• Total Payments by Period
• Payment Summary
• Total Commission, Bonus and Draw by Period
• Total Bonus by Type
The Cost Analysis dashboard displays the following information (in the business currency):
• Total Incentive Expense
• Number of Credits per Order by Period
• Top 10 Products by Commission
• Top 10 Products by Bonus
• Top 10 Products by Payment
5. When viewing information on a dashboard, you can do the following:
• Hover over a column heading and click the![]() or
or ![]() button to sort tabular columns
button to sort tabular columns
ascending or descending (respectively)
• Hover over a column heading and drag and drop the ![]() tab to move a
tab to move a
column to a new location (in the table).
• Hover over a bar in a bar chart to have the corresponding values appear in a
pop-up.
